|
Feature
Falcon Flight Model Evolution
by Leon
"Badboy" Smith
Introduction
In this
article we will consider the evolution of the Falcon series
flight model and explore some of the implications of changes
in the performance of the default F-16, in terms of the resulting
influence on dissimilar air combat, and in particular, with
the F-16 v MiG-29 engagement.
Some History
Firstly though, if you cast your mind
back to the beginning of 1995, you may remember a utility
called Falcon Test Pilot (FTP) and how it gave a new
lease of life to Falcon3. At a time when we had all been flying
Spectrum Holobyte's Falcon 3.0 for four years already,
suddenly it was possible for players to fly all of the aircraft
in the game. Dissimilar air combat, against real opponents,
was a refreshing change for anyone who had been flying F-16
v F-16 in online competition for years. However, the different
characteristics of so many new aircraft presented a formidable
challenge! That inspired me to prepare an analysis of the
performance of the Falcon3 aircraft, both the Complex and
High Fidelity flight models, and many of the other aircraft
that could then be flown. In the September '95 issue of "Enemy
Lock On" magazine I published an eight page special feature
that included this analysis in the form of about twenty Energy
Maneuverability (EM) diagrams, with accompanying explanation.
Now, nine years since then, and about twenty years since Falcon's
birth (If we count from F-16 Fighting Falcon released in 1984),
it is still possible to fly all of the aircraft in the modern
version, and thanks to a small group of highly skilled and
enthusiastic volunteers, the flight model of each of them
is still evolving, and getting better with each generation!
Back then, Falcon 3.0 had three different
flight models, a simple flight model, a complex flight model
and the high fidelity flight model. It was possible, only
with the aid of FTP to edit the complex flight model, today
in Falcon 4.0, something similar is possible because a lot
of the aero and engine data is contained in look up tables
that are very easy to interpret and edit. In this article
I hope to provide you with an insight into the development
of the Falcon 4.0 series flight model, and its evolution through
some of the versions, with some discussion on the implications
this has had to the resulting air combat.
But first, for those of you who may
be unfamiliar with the method of comparison I'm going to be
using, I'll just say a few words about Energy Maneuverability
diagrams. The Concept used in these diagrams was originally
a British invention, and has been used to analyze the turning
performance of fighters since the beginning of World War II.
A more recent adaptation of the method was developed by Boyd
and Christie who coined the phrase "Energy Maneuverability"
to describe the duel purpose of such diagrams. A previous
article describing the application of these diagrams can be
seen here,
and for those who need to brush up on what the lines and curves
mean, there is a slightly more in-depth description in the
article here,
and although the latter article is more concerned with prop'
fighters, the EM theory is essentially the same.
Go
To Page 2
Feature: Falcon Flight Model Evolution
Back To Page 1
The Default SP4 F-16 Flight Model
So, finally, here is the EM diagram
for the default SP4 F-16 (note: click the image below for
a larger version).
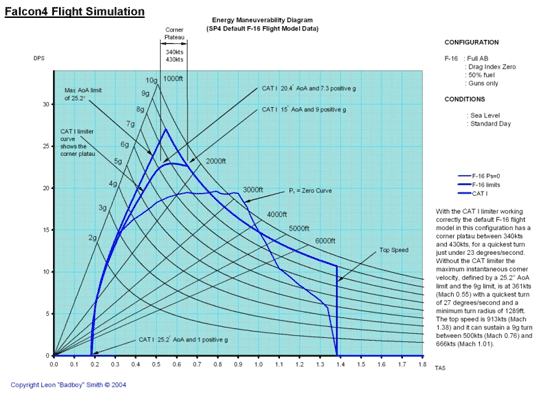
Notice that there are two curves on
the left of this diagram, one is marked as the Max AoA (Angle
of Attack) limit of 25.2 and the other is marked up as the
CAT 1 limiter curve. So, this is a good time for an important
disclaimer… Firstly, the CAT 1 limiter shown on this
diagram uses the control laws used by the real F-16, and this
may or may not be what is being used in Falcon 4.0's flight
model, but in view of the excellent work normally carried
out by the flight model development team, I strongly suspect
that it is. In this diagram I've shown both limits as a comparison
between the maximum angle of attack limit allowed in the data
tables of 25.2 and the real CAT I limiter for the F-16. The
CAT I limiter is important because it informs us of the true
constraints on the flight envelope and thus the location for
the corner plateau, which in this case is between 340kts and
430kts with a maximum turn rate of twenty three degrees per
second. However, in subsequent diagrams I will omit the CAT
1 limiter curve, and use the maximum AoA limit, simply because
that is the limit used by most of the adversary aircraft,
and because the diagrams should be thought of as a comparison
of the data used by the flight model, and not a comparison
of the flight model itself. That distinction is important,
because when the tool used to produce these diagrams was developed,
even though I had a copy of the flight model, it was intended
for the analysis of real aircraft and was not based directly
upon the Falcon 4.0 code, even though the methods used in
the simulation are fairly standard, and quite typical.
So the natural question for readers
is, how accurate are these diagrams? There are a number of
considerations here, firstly, due differences in the Falcon
4.0 code (including errors) and the code I use in my analysis
tools, such as the methods used to solve the equations of
motion, for example, there are some small discrepancies between
these diagrams, and the performance that can be ascertained
by flight testing in the simulation. As an example of what
I mean, the equations of motion in a flight model require
that a set of simultaneous differential equations be solved,
and it is typical for flight simulations to use lower order
numerical methods and solve at relatively low frequency to
conserve processor cycles for other important code, such as
the artificial intelligence, the campaign engine, the flight
models for computer controlled aircraft, weapons models such
as the various types of missiles and guns, damage modeling,
graphics and… well you get the idea. In contrast to that,
when producing diagrams such as the ones used in this article
there is the luxury of using more accurate methods and solving
at higher frequency, so differences are bound to exist. However
these discrepancies have been found to be small, and most
of the important comparisons between the aircraft, such as
their instantaneous and sustained turn performance across
the envelope, and comparisons between their relative turn
rates and radii, can all be verified by flight testing, and
correspond to a degree that makes no practical difference
to the air combat.
Now let's just talk about the Ps =
0 curve for a moment, you can see it clearly marked on the
diagram above. That curve is important because it represents
the turning performance that can be sustained in a level turn.
Don't worry that this curve isn't smooth, it is an accurate
representation of the data used by the Falcon 4.0's flight
model and because that data is contained in look-up tables
that have discrete values, the steps in the curve are therefore
unavoidable. Indeed, this is one of the many areas in which
the flight model has improved, because the number of data
points has increased and so the Ps = 0 curve is smoother now
than it has been in the past, and is therefore able, potentially,
to match the real curves more closely. However, the important
thing to remember here is that if you fly at a point above
that curve your aircraft will be losing energy, either speed
or altitude. If you fly at a point below that curve, you will
be gaining energy, you will either gain speed, or have the
ability to climb in the turn.
That's why, when we compare the EM
diagrams for different fighters by overlaying them, the fighter
with the higher Ps = 0 curve has a sustained turn rate advantage,
and is most likely to win a sustained turning engagement.
So, one of the first things to notice when you look at an
overlay of this type, is to compare the Ps curves across the
envelope, to see where you can gain energy, or lose it less
quickly, while out turning your opponent. But that's if the
fight ever gets to a sustained turning engagement! A high
sustained turn rate isn't everything, fast transients are
also important. For example, an aircraft with a high pitch
rate or high instantaneous turn rate could end the fight early
by getting the first shot. That ability is defined by the
highest point on the envelope, either the one defined by the
25.2 angle of attack limit, or the one defined by the corner
plateau caused by the CAT 1 Limiter. Naturally, the Russian
aircraft that have relatively high angle of attack limits
have an advantage in that department, and can reach maximum
instantaneous turn rate values far in excess of the CAT 1
limited F-16, albeit a brief advantage due to the resulting
rapid loss of energy. Now, I know you want to see a concrete
example of this, and in a moment we will look at the F-16
v MiG-29 engagement, but firstly let's compare the diagram
above for the current default F-16, with previous versions
of the F-16 flight model.
Go
To Page 3
Feature: Falcon Flight Model Evolution
Back To Page 2
Original,
SP3 and SP4 F-16 Comparison
Here is a diagram that shows the evolution of the default
F-16 from the original, through SP3 to SP4:
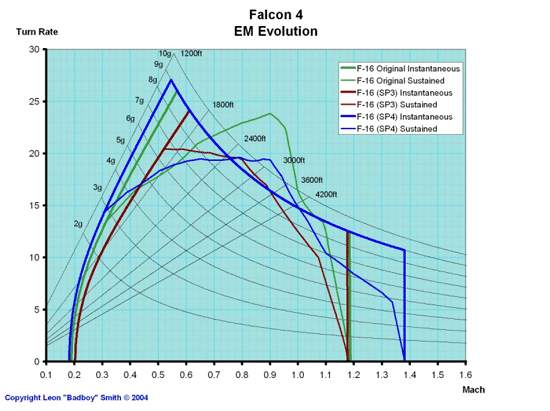
In this set of curves, I haven't shown
the CAT 1 limit for the F-16 for the reasons explained earlier
and also because the CAT 1 limiter hasn't been employed consistently
through each version. Even so, this overlay does give an insight
into the way the data has changed, and the effect that has
had on the sustained and instantaneous turning ability of
each of the default F-16s. The important thing to notice from
this set of overlays is that the SP3 F16's zero Ps curve (shown
in brown) was a major departure from the original (green)
curve. Notice that both the original green and current blue
zero Ps curves fall off dramatically below corner velocity,
while the SP3 zero Ps curve did not. That of course resulted
in dramatically different handling characteristics. The original
Ps = 0 curve behavior was, when compared with the real F-16
EM diagram, closer to that of the real F-16's zero Ps curve
and so the SP3 flight model was, I believe, a step backwards.
Hardly surprising then, that the SP4
zero Ps curve (shown in blue) is much closer now to the original
green curve, particularly below corner speed... You might
be getting the feeling that we have been riding our flight
models around in circles, if you can forgive the pun. The
point is that, in terms of the low speed sustained turning
ability, the current default flight model has now taken positive
steps back to where it started. The shape of the current Ps
= 0 curve, as with the original, now demands proper energy
management. Remember, I mentioned the dramatic effect on aircraft
handling characteristics? Well, you can now no longer simply
hold full aft stick, as you could with the SP3 flight model,
and expect to get good results. In SP3 you could simply hold
full aft stick to achieve the best sustained turn rate, and
while that certainly made it easier to fly, it removed the
skill required in learning to hold just the right amount of
back pressure to achieve the flight conditions for the best
sustained turn rate. With SP3, everyone became a good stick
overnight. So fortunately, the SP4 flight model has corrected
this behavior and it is now as it should be, once again. There
is of course, room here for more detailed discussion of the
development of the various Falcon 4.0 flight models, and possibly
some EM comparisons to the real F-16, but that would be more
appropriate for another article. The point to take away from
all of this is that the Falcon 4.0 flight models are evolving,
and they are getting better. The work of the guys involved
in developing the flight models is difficult, and thankless,
and generally the good work they are doing, in my opinion
does not get the recognition or appreciation it deserves,
but I digress, let's get back to the fun stuff.
MiG-29 v F-16
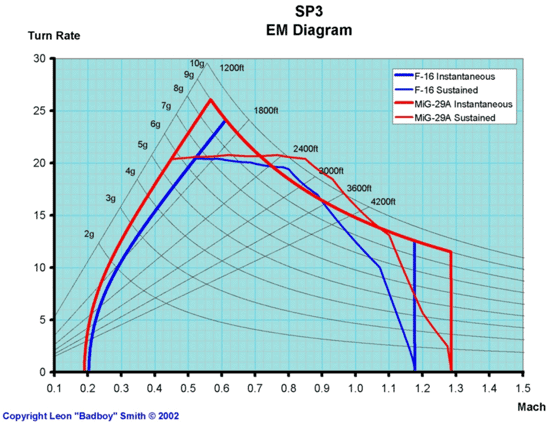
So what about the MiG-29 v F-16 within
visual range engagement? Here is a Sea Level EM diagram overlay
from the original game...

These two aircraft were clearly closely
matched, with just enough of an edge to the F-16, in terms
of its low speed sustained turning ability, to make it a tough
fight, but close enough so that if the player made a mistake,
the Artificial Intelligence could take advantage and clean
up. It was tough, because you can see from this diagram that
the MiG-29 still had an instantaneous turn rate advantage,
but the fight was always a lot of fun, because you could win.
Go
To Page 4
Feature: Falcon Flight Model Evolution
Back To Page 3
MiG-29 v
F-16
Now compare that with what happened in SP3, the diagram is
shown below. Here you notice that the MiG-29 has improved,
relatively speaking, and is now superior to the F-16 over
the entire envelope, and has a smaller turn radius, but only
marginally. The biggest difference, is of course, the fact
that the F-16's Ps = 0 curve can be seen to climb to the left,
increasing as the speed decreased. That meant that the slower
you got, the higher your sustained turn rate became, and that
simply allows the pilot to hold full aft stick for best performance,
a dramatic change from the original version that demanded
proper energy management. Of course, just holding full aft
stick for best results is not the way the aircraft is or should
be flown! This reinforced the bad habits simulation pilots
may have acquired flying other simulations with similarly
flawed flight models, examples of such simulations abound.
Despite that step in the wrong direction, the relative performance
between the MiG-29 and the F-16 was still close, and even
though the MiG-29 was more difficult to beat, it was, due
to weaknesses in the Artificial Intelligence (AI), quite beatable.
What happened next, is that the default F-16 flight model
changed to that seen in the first diagram, while the MiG-29
flight model remained the same as it was in SP3. The result
is shown below, and notice the significant loss in sustained
turning ability, of more than five degrees per second relative
to the MiG-29:

Now, because the MiG-29 has remained
the same in both SP3 and SP4 we can overlay it with both the
SP3 and SP4 F-16 to see the difference, here it is:
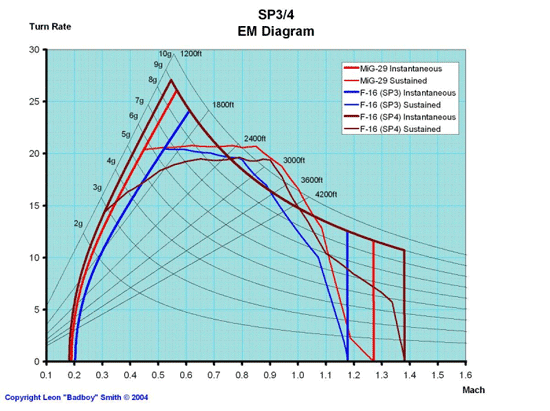
By retaining the MiG-29 flight model
from SP3 the default SP4 F-16 is now outclassed in terms of
its manoeuvrability, conceding more than five degrees/second
at low speed. That's a lot to give away, when you consider
that as little as two degrees per second is considered to
be a decisive advantage! This is the biggest disparity in
turning performance between the MiG-29 and F-16 in Falcon4
to date, and makes any protracted sustained turning engagement
extremely difficult for the F-16 driver, even though the SP4
F-16 is slightly faster.
Just that comparison alone and the
differences it makes to the MiG-29 engagement, aircraft handling
and energy management are such that pilots converting from
the SP3 to SP4 flight model would notice that they are no
longer able to do what the F-16 has always been good at…
turning!
Go
To Page 5
Feature: Falcon Flight Model Evolution
Back To Page 4
Now, energy tactics become more appropriate.
Updating on the new aircraft handling and energy management
requirements for SP4, based on this diagram, suggests that
due to the F-16's higher energy bleed rate and lower sustained
speed, he should choose the one circle fight and early high
aspect shots, scissors type maneuvers, followed by extensions
if guns only, due to the higher top speed... then rinse and
repeat. Let's take a look at that in diagram form. Below you
see the sustained turning performance of both aircraft shown
in a way that illustrates their relative turn radius and turn
rate, it shows the relative position of both aircraft during
a turn lasting six seconds.
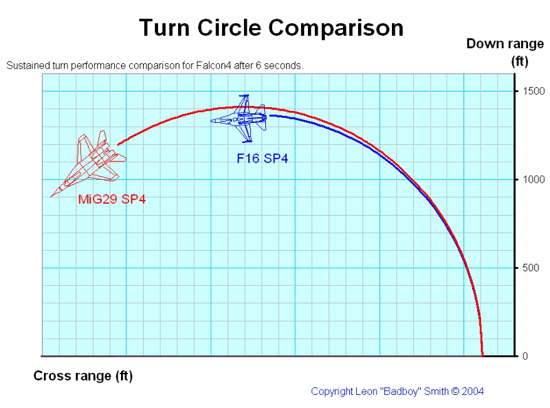
You can see that while the turn radius
of both aircraft is very similar, the MiG-29 has gained a
significant angular advantage. In order to counter that, I
mentioned previously that the F-16 driver should choose the
one circle fight and early high aspect shots, and scissors
type maneuvers, the diagram below shows how that should work.
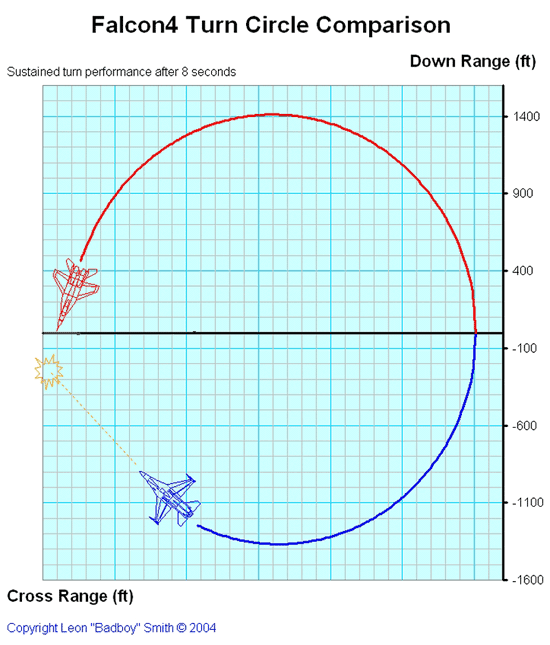
Here you see that even though the
MiG-29's sustained turn rate is superior, the F-16 gets the
first shot in this situation. If you miss the shot, reverse
again into a scissors, and try again, or if the situation
(other enemy fighters approaching or low ammunition or fuel)
dictates, take the shot and use the time required for the
MiG to reverse, to execute a zero G extension, but only providing
the MiG doesn't have a missile still on the rails.
The real difficulty for the
humble flight sim pilot is that the appropriate tactics have
changed along with the flight model, so the big question is,
now that we have the new High fidelity flight models how have
they influenced the air combat? In the second part, we will
look at the performance of the F-16 and consider the Dissimilar
Air Combat implications for the F-16 versus MiG-29, F-16 versus
Su-27 engagements. Lastly, as pointed out earlier, there is
a small group of highly skilled and enthusiastic volunteers
working constantly on the flight models and much of their
work has been directed towards accurate modeling of the different
F-16 blocks and variants including the different engine and
airframe combinations, so in part two we can also take a look
at the outcome of their efforts, as they strive to ensure
that Falcon4 remains the most accurate simulation of modern
air combat currently available.
Download a pdf of this
article here
(x kb).
We want your Feedback.
Please let us know what you thought of this article here.
Click
here to go to top of this page.
Copyright 2008, SimHQ.com. All Rights Reserved. Contact the webmaster.
|

