by Leon “Badboy” Smith
Introduction
Pilots who fly Aces High face a formidable challenge…with many different fighters from which to choose, how do they select an aircraft that will best meet their combat needs? Some pilots may choose an aircraft because of its romantic history or combat record, others may choose an aircraft based only on appearance. Regardless of what it is that endears us to some aircraft, it is true that certain aircraft appear to be flown far more frequently than others. Made popular by real world events and famous pilots, aircraft like the Lightning, Spitfire, and Mustang, to name but a few, will always enjoy attention from the continuous influx of new pilots to the simulation. However, it takes more than a great aircraft to make a great Ace. Disposing of new pilots, even though they may be flying the best aircraft, will always be as easy as culling baby seals… Even so, flying a great aircraft is still a very good start! The problem is that many new pilots are unaware of what made the aircraft great in the first place!
Over the years I have watched the ebb and flow of the popularity of certain aircraft. In Aces High, great pilots have the ability to promote the aircraft they fly with their success as an example. Just as in the real world, it is possible for good pilots to give the impression that their aircraft are far more potent than the performance figures would suggest. For example, I once impressed a new pilot by defeating his Spitfire with a P-38L. He believed it should have been an inferior aircraft, and as modeled in Aces High version 1.04, it certainly was. For his next sortie, he was flying the P-38L, and he naturally assumed that it was the aircraft that made all the difference. However, it has been true throughout the history of air combat that the pilot and not the machine is what makes the difference between the Ace and the also-ran. When he began to complain that the aircraft I was flying must be hacked (illegally modified program code) or that I must have been cheating, because the Spitfire should have been able to win, I explained something that impressed him even more than my modest flying skills… The P-38 (and indeed many other aircraft) was successful, not because it was the best airplane, but because it was often flown by the best pilots! pilots who knew how to get the best from it!
When new pilots are attracted to an aircraft by the prowess of those who fly it, they are often disappointed when their results are less impressive. A good pilot can make an average aircraft seem great. By flying an aircraft in a way that highlights its strengths, while minimizing its weaknesses, almost any fighter can defeat any other. However, the ability to judge where one aircraft has an advantage over another has normally only been possible as the result of many hours of long hard experience. Even then, some aspects of aircraft performance have remained contentious and clouded with an air of mystery. Part of the reason for this is, of course, the variation in pilot ability. A person might be able to out turn a particular aircraft when some pilots fly it and yet be unable to do so when others are flying it. While that sort of experience only serves to confuse us as we learn to handle new aircraft, it does highlight the need for a better method of performance comparison in dissimilar air combat engagements.
As the ability of our opponents improve, due to the better training and education available in basic fighter maneuvers and air combat tactics, we must seek every possible advantage. We must fly our aircraft to the limit of its performance capabilities. More importantly, in dissimilar aircraft engagements, we must fly in a way that maximizes the strengths of our aircraft while exploiting the weaknesses of our opponent’s aircraft. This idea is familiar to Fighter Weapons School (TOPGUN) graduates…
“Know and use all the capabilities in your airplane. If you don’t, sooner or later, some guy who does use them all will kick your ass.”
Lieutenant Dave “Preacher” Pace, USN
U.S. Navy Fighter Weapons School Instructor
For Aces High pilots. this is even more important due to the large variety of accurately modeled aircraft available to fly. However, there is one other factor that serves to confuse matters. That is the sometimes-noticed disparity between real world data and that observed during simulated flight. So, by way of disclaimer, a brief note regarding fidelity. Flight sim pilots who read history have an impression of the performance of their favorite aircraft. However, reliable and accurate data is hard to get. Data sources that vary between the manufacture, scientific establishments and test agencies and air forces that used the aircraft operationally often conflict. For that reason, experienced and competitive flight sim’ pilots won’t assume that the aircraft being modeled will compare exactly to their expectations. They do, however, expect the physics of the flight modeling to be sophisticated enough that real world tactics can be successfully employed against their opponents. What is most important in a competitive environment is not how close the performance of the flight model matches that of the real aircraft, but how the in-sim aircraft performance compares with each other. After all, that is what will count in our next engagement! The simple fact is this…in terms of both the physical aerodynamics model and the data used to drive it, Aces High is (along with a small number of competitors) at the cutting edge of current technology. But even so, what we need, as pilots of Aces High aircraft, is data that relates to those aircraft as they perform in the simulation! Therefore the information that follows relates to the aircraft performance within the simulation, after all that’s what matters most when flying online!
The Method
A method of performance comparison that was developed in the 1960s allows a pilot to compare the performance of different fighters and determine which one is superior to the other at each point in the envelope. So, for example, a pilot might compare the flying characteristics of an F-16 to those of a MiG-29 and thus identify which regions of the flight envelope are most advantageous or dangerous to him. The method revolutionized the way the USAF looked at tactics and designed fighters. It was used to analyze the F-4 Phantom v MiG-17 match up in Vietnam and resulted in new tactics for the Phantom that in turn lead to more MiG kills. It was used to design the F-15 and was largely responsible for that aircraft being the successful, high performance, maneuvering fighter that we know today. The method is based upon the theory of Energy Maneuverability (EM) and can be translated into simple diagrams that are so easy to read that they allow aircraft comparison at a glance.
Quit simply, the method involves producing EM diagrams for each fighter and then overlaying them for comparison. Of course, such methods were unheard of in W.W.II and pilots of the day relied on less exact methods. However if you want to learn how to fly your favorite aircraft to the full, and squeeze every drop of performance from the flight model in order to win against less well-informed pilots, you will benefit greatly from the application of these methods. In the next section I will explain how it works, and if you are already familiar with EM theory, you can skip this section completely.

The Theory
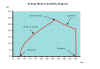
EM diagrams contains a great deal of valuable information…so much information that at first sight they can sometimes be confusing. So rather then hitting you with the whole thing, let’s build one, piece by piece. Let’s build our first EM diagram and see how they are used. Basically the E-M diagram is a graph with two axes. It has turn rate on one axis in degrees per second (dps) and true airspeed on the other in mph, as shown in Fig1.
If you knew, for example, that the aircraft in question could achieve a maximum turn rate of 27dps at 275mph you could mark that point on the graph as shown by the red dot. However, knowing the maximum performance at a single point on the graph is not very useful. Ideally we should know the maximum turn rate throughout the envelope. If we were able to determine the maximum performance at every point in the envelope and plotted it to form a continuous line of dots, it might look like the graph shown in Fig2.

In this diagram, the thick red curve represents the maximum instantaneous turn rate…that’s the upper limit of the envelope. The aircraft can fly at points below this line, but not above it. You will notice that the shape of the curve rises to a peak, similar to the shape of a doghouse, which is why real fighter pilots refer to these diagrams as doghouse plots. At that peak, the highest point on the curve, the turn rate is a maximum. That point occurs at a speed known as the corner velocity. At this point in the development of our first EM diagram, all we can say from looking at this incomplete version is that the corner velocity occurs at around 260mph for this aircraft, and that at this speed you can achieve the maximum turn rate of 28.6 degrees per second. To the left of the corner velocity the envelope is bound by the lift limit. The aircraft can’t fly above this line, because it can’t produce enough lift…it stalls. Sometimes I will refer to this line as the stall line because you can use it to determine where high-speed, or accelerated, stalls will occur. To the right of the corner speed the envelope is bound by a line that can represent a g limit, a structural limit, or a pilot physiological limit. Because we black out at 6g in Aces High, this line represents that load limit. And of course the diagram stops bluntly at the top speed in level flight for the altitude represented in the diagram, in this case sea level.
Even now, with a lot of important information missing, we have already obtained valuable information. Many flight sim pilots will never learn the true value of the corner velocity for the aircraft in their favorite flight sim. Flying competitively against other flight sim pilots without knowing the corner velocity, or even worse…having a false value, inevitably means flying your aircraft below its capacity. There are many pilots in Aces High who fly their aircraft at something less than its best. They fly it below optimum conditions simply through the lack of reliable data. The correct corner speed is valuable information and our EM Diagram has already provided us with this knowledge. The ability to fly at corner speed and thus maximize the turn rate is important, but not the whole story. To complete another missing piece of the jigsaw, our diagram can include information on the turn radius capability of the aircraft and the G force producing it. This information can be overlaid onto the existing graph as shown in Fig3.

Here lines of constant turn radius and constant g force have been overlaid onto the graph. You can now see, for example, that if you pull 5g at 250mph you will have a turn rate of just under 25dps and a turn radius of about 850ft. You will also notice that the turn radius for this aircraft at the corner velocity is about 760ft. An important observation here is to notice what happens if you pull 6g at even greater speeds, see how the turn rate drops and the turn radius increases? The conclusion of course is that turning above corner speed has a detrimental effect on your maneuverability! Already we have a lot of important information, but we aren’t done yet.
The red curve shown above represents our instantaneous turning ability. That means that the values indicated on the curve can only be achieved for an instant. For example, if you are at your corner speed of 260mph and pull 6g, you will achieve a turn rate of 28.6dps but only momentarily. No sooner than you achieve it, the huge increase in induced drag caused by all that additional lift will reduce your speed so that you will no longer be able to maintain 6g, and your turn rate will suffer accordingly. For example, by the time your speed bleeds to 245mph, the diagram shows that your turn rate will have dropped to 27dps. Notice that once you are below corner speed, further loss of speed results in loss of turn rate. This is a much more important phenomenon than you might at first think! It suddenly reduces the importance of our corner speed. After all, what use is that knowledge, if it can only be achieved fleetingly? The answer is that corner speed should act more as a signpost! The corner velocity signpost points to where you really want to be, even though you know that when the turning starts you can’t stay there, you don’t want to be too far above it, or too far below it. However, this raises an even more important question! Aircraft lose speed in hard turns, but as they lose speed the drag becomes less and less until it balances the thrust produced by the propeller, at which point no more speed will be lost and the turn can be sustained. All aircraft lose speed in hard turns but they all lose it at different rates and end up in different sustained turns. Those that lose speed less quickly have an advantage, as do those that can sustain higher turn rates. So, the important question is how quickly do they lose speed, and what turns can they sustain. Those questions can be answered by introducing one more curve onto our graph. Take a moment to consider Fig4.

This additional curve joins all the points in the envelope that the aircraft can sustain in a level turn, without gaining or losing speed. If you fly above this curve you will lose speed and decelerate; if you fly below this curve you will gain speed and accelerate. So, because the 3g curve is entirely above the sustained turn curve, it means this aircraft can not hold 3g without losing speed. Ok, let’s look at a couple of examples; notice that at 300mph this aircraft can sustain a turn at 10dps and that at 225mph it can sustain a turn of 15dps. At the extremes of this curve, notice that at the aircraft’s top speed it can’t turn at all without losing speed. At the other end it has its best-sustained turn, that is the turn with the highest turn rate, and it occurs for this aircraft a little under 18dps and about an 800ft turn radius. Those are all values that you can sustain in a level turn, and that is extremely valuable information, but we aren’t done with this curve yet, because it can tell us something about how quickly we will lose speed once we begin turning. Quite simply, the higher above this curve you fly, the faster you will lose energy. So, for example, if you pull 3g at 250mph, you will lose speed slowly, and in order to sustain that turn you would only need to lose altitude at the rate of about 3ft every second. We know the speed loss will be low because the 3g line is only just above the sustained turn line. However, if you pull 6g at 260mph (corner speed) you would need to lose height at the rate of 123ft every second. That would require that the pilot hold the nose of the aircraft about 19 degrees below the horizon, which is quite impractical in a dogfight, because to do so would at worst mean creating enough turning room below an opponent to concede a shot, or at best simply spiraling out of the fight. For you to be able to quantify the rate of energy loss as I have just done, this graph would need to contain more curves. The sustained turn curve shown above represents zero energy loss, but we could include curves that indicate the rate of energy gain or loss like the one shown in Fig5.

On this diagram, the dotted red lines are drawn at intervals that indicate rate of climb or descent at 20ft per second apart. For example, if you wanted to sustain flight anywhere on the line marked -20, you could only do it by losing altitude at the rate of 20ft every second. Also, if you wanted to sustain flight on the line marked +20, you could do so while gaining altitude at the rate of 20ft every second. If you look at the diagram now you will notice that this aircraft can climb at 20ft every second (1200ft/min) while holding a 2g turn at 250mph. Because we can see how much and how quickly altitude would need to be gained or lost in order to maintain any given flight condition, we have a very good idea of how this aircraft gains or loses energy while turning. While that level of information is very impressive, we have a problem. It is my intention to overlay diagrams for one aircraft, with those for another, so that we can compare one with the other. However, if we include whole sets of curves for the rates of energy loss, those diagrams become so cluttered they are impossible to read. Fortunately, when you overlay these diagrams, it is possible to make all the important comparisons providing we retain the sustained turn curve, so in all future diagrams that is all we will need. That’s enough of the theory, let’s put what we have learned so far to good use… It’s time to show you how to do some aircraft comparisons!

One of my favorite aircraft in any simulation is the Spitfire. In my case, a preference for the Spitfire has less to do with its flying qualities, than its national origin. It’s more a matter of national pride than aircraft performance. Having decided to fly a Spitfire, the question remains… Which one? Take a look at Fig6.
Related Posts:
Related posts:
 Energy Management: Picking The Right Airplane For The Job Page 2
 Falcon Flight Model Evolution Page 2
Falcon Flight Model Evolution Page 3
Falcon Flight Model Evolution Page 2
Falcon Flight Model Evolution Page 3
 Forgotten Battles: A Reality Check
 How to be a Good Stick in LOMAC Page 2
How to be a Good Stick in LOMAC Page 3
How to be a Good Stick in LOMAC Page 4
How to be a Good Stick in LOMAC Page 2
How to be a Good Stick in LOMAC Page 3
How to be a Good Stick in LOMAC Page 4
 Secondary Flight Controls – Flaps Page 4