by Mark “Boxer” Doran and Leon “Badboy” Smith
Falcon4, the game, is more than two years old now. For most flight simulation games a title that old would already be gathering dust. However, Falcon4 is among that elite club of “classic” simulations that endures rather longer, thanks mostly to a dedicated fan base and the creativity of those fans in enhancing what was already a great game with a steady stream of refinements.
One of the most influential trends in the Falcon4 community is the Realism Patch Group that has now delivered four major updates for the original game. More are in the works. As the name implies, these updates have refined the realistic behavior of weapons and produced ever more faithful representations of the aircraft and vehicles modeled in the game. The most recent update Realism Patch 4 (current at revision RP4.1) introduced a new selection of flight models. Mostly aimed at the Western (US/NATO) aircraft to date, the eventual goal is to update all of the flight models for aircraft in the game to the best possible state, given the limitations of publicly available and unclassified information.
With this renewed emphasis on flight model tweaking in the Falcon4 community, we thought it might be interesting to take a look at the theoretical view of how the newer flight models stack up. The aim is to examine what you might expect to see in practical terms for players engaged in 1v1 dogfights using the new flight models.
The approach we will take is to start with the values from the data files, as tweaked, and use those to derive performance curves for the aircraft in question and then compare them to project how the fight should play out in the virtual air. It is also instructive to look at the curves derived from the actual data files and compare to what such curves should theoretically look. This can shed light on how well the data file tweaks are coming along and what areas might still be open for further refinement.
For the purposes of this article we will focus on the F-16 and the MiG-29 as modeled in Falcon4 RP4.1. The same techniques however can in theory be applied to any combination of aircraft modeled in the game.
Doghouse Plots
The curves drawn on the performance graphs will look familiar to those of you that have seen Badboy’s work in places such as the EF2000 strategy guide and more recently in feature articles here at SimHQ.com. They are a representation of the energy-maneuverability state of the aircraft drawn onto a two dimensional graph.
Rather than explain again how these work, you should refer to the feature article where all is revealed about how to interpret the lines and numbers. If you are interested in learning more about the theory behind these diagrams try looking in the back of your copy of Robert Shaw’s “Fighter Combat” – the appendix has an approachable description of how the forces of flight affect energy and maneuverability considerations and gives some of the equations that go into making graphs like these. If you want the really in depth treatment, you can look out a copy of the “Aerodynamics for Naval Aviators” book published by Aviation Supplies & Academics (ISBN 1-56027-140-X, but be warned it’s pretty dense stuff!).
Note that we will draw curves for both the Viper and the Fulcrum overlaid on each other. This makes the graphs a little busy but it’s by far the easiest way to get a good visual picture of how the two jets match up. The F-16 will be blue lines and the MiG-29 will be drawn in red. Heavy lines will mark the flight envelope limits determined by aerodynamic design, structural g load tolerance and maximum design speed. The lighter lines will represent neutral Specific Excess Power (Ps = 0), the curve representing the point at which available thrust is not able to generate further acceleration.
The calculations used to derive the data for these curve plots are made using the same level of complexity as the flight model in the game. As such, the curves will be a true representation of what you will see in the game. That said, there are some assumptions made in performing the calculations that are used to plot the curves but these are situational. The same treatment is applied to generating curves for both aircraft. For example, in each case we start with clean aircraft, free of external stores but with 100% internal fuel aboard. All the calculations are done with maximum thrust available used also, with the engine in full afterburner. We will also only consider level turn performance for comparative purposes. Lastly, we assume a standard atmosphere.
Down in the Weeds
Starting from the data in the flight model files, you can derive lots of interesting performance numbers for any of the aircraft in the game.
For example, at sea level the flight model data gives us a number of data points to play with. The Viper has a gross weight of 25089lbs and a maximum speed of 783kts or 653kts at full military power. Corner velocity in this configuration is 372kts. Maximum rate of climb from sea level comes out at 51945ft/min with an absolute ceiling of 60701ft. With power reduced to full military, maximum climb rate drops to 47307ft/min with an absolute ceiling of 53430ft.
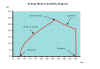
For the purposes of this article though we want to focus on aerodynamic limits, structural limits, airspeed limits and sustained turn rate (achieved at Ps = 0) as depicted on the energy maneuverability chart. Here is the chart for mean sea level for the two aircraft.

The curves seem almost to be overlaid right on top of each other. From this it’s easy to see that the fight will be very close, all other things being equal.
Looking first at the Ps curves, the MiG-29 has slightly worse sustained turn performance through most of the envelope as the red Pscurve stays below the blue curve. Only at the very low end of the speed range, where the engine/inlet design of the F-16 reduce it’s sustained turn rate, can the MiG-29 hold a turn better than the F-16. For the most part though, the F-16 can hold turn rates marginally better provided the fight stays above 220kts. However this advantage is razor thin for the F-16 pilot and for all practical purposes won’t really be exploitable.
The left side of the limit curves shows the aerodynamic limits of the two jets which govern the amount of lift that can be generated and hence the instantaneous turn rate. In this case, the MiG-29 has advantages in both higher instantaneous turn rate and smaller turn radius at any given speed up to corner speed for the F-16 (recall that corner speed is the highest apex of the limit curves).
From the F-16’s corner speed up to the design airspeed limit (the vertical line at the right hand side of the limit curves) of the two airframes, turn rate and radius are in lock step for both aircraft. Notice that the F-16’s top airspeed is a smidgeon higher than that for the MiG-29 but once again, making advantage out of that is likely to be difficult.
The Heart of the Envelope
The heart of the dog-fighting envelope at least is in the medium altitude range. For our purposes we will use 15 thousand feet as the reference altitude.

Here again we can see by looking at the aerodynamic part of the limit curve that the MiG-29 can generate higher instantaneous turn rates and at smaller turn radius than the F-16 up to corner speed for the Viper at around 440kts true airspeed.
However, the MiG-29 now also has the advantage in sustained turn rate up to 485kts at which point the F-16’s sustained turn rate takes over the advantage. The margin is still narrow but a little more pronounced than that we saw at sea level for the F-16. Anywhere in the range of 200-350kts, the MiG pilot should be able to gain advantage in a level turning fight started from a neutral position.
At this altitude, neither jet can sustain 9g with the F-16 topping out at 8.6g sustained and the MiG-29 holding only 7.5g. The Ps curves cross over at roughly 485kts and the gap widens out from this point. As a result the F-16 will enjoy a significant advantage if the fight stays fast and level.
Notice also that the Viper has a considerable margin in top speed at this altitude. At the higher end of the spectrum then, the F-16 pilot may be able to use this in combination with higher specific excess power (applied to straight line acceleration) to separate in a guns only environment if the timing of the break is carefully arranged.
At lower speeds the fight is still well balanced but at this altitude, the F-16 pilot would do well to keep the fight at speeds above 500kts where his jet will have a distinct sustained turn rate advantage.
Into Thin Air
Occasionally you may find yourself high up where the atmosphere is thinner and the performance both of the aerodynamic surfaces and the engines starts to degrade.

At this altitude things are starting to look positively dicey for the F-16. The MiG-29 enjoys a noticeable sustained turn rate advantage at all speeds up to 850kts. Both aircraft struggle to sustain g load in the thinner air. Reading from the Ps curves, the MiG-29 peaks at just over 6g at around 780kts. The F-16 sustains less than 5g up to 750kts peaking at a mere 5.7g at a whopping 940kts.
In this case, superior sustained turn rate simply adds another advantage to those already realized by the MiG pilot at lower altitudes. Here too the MiG-29 enjoys smaller turn radii and instantaneous turn rates up to corner speed for the F-16, although these margins remain pretty slim.
The top speed advantage also erodes somewhat at the higher elevations but the F-16 still holds the edge in that department. This is probably of little practical value however.
Taken overall, the MiG pilot has decisive advantage at or below the corner speed of the F-16 given greater ability to point the nose with instantaneous turn rate, tighter turns and better ability to keep the pressure on with high sustained turn rates. Above corner speed the limits of turn radius and instantaneous turn rate even out at the load limit line but up to 850kts the MiG-29 still has the ability to sustain higher turn rates than the F-16.
In practical terms, the F-16 should try and avoid engaging at this altitude all other things being equal. You are better off trying to drag the fight down to lower altitudes if avoiding the engagement isn’t practical.
Theory and Opportunities
With regards to what pure theory would predict for these curves there’s one obvious anomaly in the Falcon4 data for both airframes. Generally, you would expect the Ps curves to be smooth with no oscillations in the curve gradient changes. Ideally, the data would need to be adjusted to smooth out these bumps in the Ps curves. How to go about that process is an exercise for another day however.
Another interesting question arises in the sea level curves. Notice that the Ps for both jets go up above the load limit portion of the limit curves. In theory, if the load limit were not imposed the jets could, according to these numbers, generate higher rates of turn and even sustain them albeit while applying more g load punishment to the pilot. Now for the F-16 the fly-by-wire flight controls impose this limit at 9g.
For the MiG-29 however there is no computerized limit. Reportedly the pilot can continue to pull through the initial physical resistance limiter on the stick to load up more than 9g (or at low speeds to go past 26° angle of attack). In this context the 9g load limit line seems to hobble one possible advantage for the MiG pilot, however brief that might be given black out modeling is in play.
One other intriguing possibility given the ability to derive these curves direct from the Falcon4 flight model data is that of comparing the jet as modeled in the game to the real thing. For the most part, actual flight model data for the combat aircraft modeled in Falcon4 is classified, and with good reason given that the lives of air forces’ pilots depend on it. However, many of these airframes have been around and in public view long enough that reasonably well educated guesses can be made as to their flight envelope characteristics.
Such comparison might be useful to the folks working hard to improve the flight models in the game. It might provide another means to measure the flight modeling to complement the more subjective virtual flight-testing by experts in the field. Again this is probably an exercise for another day however.
Conclusion
Overall, it seems that the current modeling for the F-16 and the MiG-29 has them finely balanced for the lower altitudes. Pilot skill is likely to be the dominant factor all other things being equal. At medium altitudes the Fulcrum will likely have the advantage if the fight slows below corner speed so the wily Viper pilot will be looking to keep as much smash on the jet as possible or drag the MiG down low to level the playing field. Crossing swords with a MiG-29 at higher elevations is a bad idea for the F-16 pilot since at all but the highest speeds the MiG should dominate the fight.
Commentary and analysis here notwithstanding, the graphs themselves make useful intelligence for us virtual pilots. This is the sort of data that the professionals would be privy to for the real aircraft and their adversaries. In modern times, it’s even likely that classified sources in the West include extremely accurate data for Russian built aircraft now that many are available for study to Western air forces.
Let us know if you think there is value in plotting out this sort of data. If there is interest enough, it may be possible to make more charts to cover other Falcon4 aircraft and scenarios.
Related posts:
 Energy Management: Picking The Right Airplane For The Job
 Page 2
Energy Management: Picking The Right Airplane For The Job
Energy Management: Picking The Right Airplane For The Job Page 2
 Falcon Flight Model Evolution Page 2
Falcon Flight Model Evolution Page 3
Falcon Flight Model Evolution Page 5
Falcon Flight Model Evolution Page 2
Falcon Flight Model Evolution Page 3
Falcon Flight Model Evolution Page 5
 How to be a Good Stick in LOMAC Page 2
How to be a Good Stick in LOMAC Page 3
How to be a Good Stick in LOMAC Page 4
How to be a Good Stick in LOMAC Page 2
How to be a Good Stick in LOMAC Page 3
How to be a Good Stick in LOMAC Page 4