The Default SP4 F-16 Flight Model
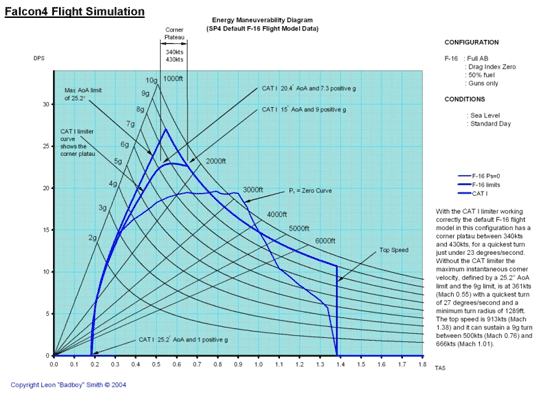
So, finally, here is the EM diagram for the default SP4 F-16 (note: click the image below for a larger version).
Notice that there are two curves on the left of this diagram, one is marked as the Max AoA (Angle of Attack) limit of 25.2 and the other is marked up as the CAT 1 limiter curve. So, this is a good time for an important disclaimer… Firstly, the CAT 1 limiter shown on this diagram uses the control laws used by the real F-16, and this may or may not be what is being used in Falcon 4.0’s flight model, but in view of the excellent work normally carried out by the flight model development team, I strongly suspect that it is. In this diagram I’ve shown both limits as a comparison between the maximum angle of attack limit allowed in the data tables of 25.2 and the real CAT I limiter for the F-16. The CAT I limiter is important because it informs us of the true constraints on the flight envelope and thus the location for the corner plateau, which in this case is between 340kts and 430kts with a maximum turn rate of twenty three degrees per second. However, in subsequent diagrams I will omit the CAT 1 limiter curve, and use the maximum AoA limit, simply because that is the limit used by most of the adversary aircraft, and because the diagrams should be thought of as a comparison of the data used by the flight model, and not a comparison of the flight model itself. That distinction is important, because when the tool used to produce these diagrams was developed, even though I had a copy of the flight model, it was intended for the analysis of real aircraft and was not based directly upon the Falcon 4.0 code, even though the methods used in the simulation are fairly standard, and quite typical.
So the natural question for readers is, how accurate are these diagrams? There are a number of considerations here, firstly, due differences in the Falcon 4.0 code (including errors) and the code I use in my analysis tools, such as the methods used to solve the equations of motion, for example, there are some small discrepancies between these diagrams, and the performance that can be ascertained by flight testing in the simulation. As an example of what I mean, the equations of motion in a flight model require that a set of simultaneous differential equations be solved, and it is typical for flight simulations to use lower order numerical methods and solve at relatively low frequency to conserve processor cycles for other important code, such as the artificial intelligence, the campaign engine, the flight models for computer controlled aircraft, weapons models such as the various types of missiles and guns, damage modeling, graphics and… well you get the idea. In contrast to that, when producing diagrams such as the ones used in this article there is the luxury of using more accurate methods and solving at higher frequency, so differences are bound to exist. However these discrepancies have been found to be small, and most of the important comparisons between the aircraft, such as their instantaneous and sustained turn performance across the envelope, and comparisons between their relative turn rates and radii, can all be verified by flight testing, and correspond to a degree that makes no practical difference to the air combat.
Now let’s just talk about the Ps = 0 curve for a moment, you can see it clearly marked on the diagram above. That curve is important because it represents the turning performance that can be sustained in a level turn. Don’t worry that this curve isn’t smooth, it is an accurate representation of the data used by the Falcon 4.0’s flight model and because that data is contained in look-up tables that have discrete values, the steps in the curve are therefore unavoidable. Indeed, this is one of the many areas in which the flight model has improved, because the number of data points has increased and so the Ps = 0 curve is smoother now than it has been in the past, and is therefore able, potentially, to match the real curves more closely. However, the important thing to remember here is that if you fly at a point above that curve your aircraft will be losing energy, either speed or altitude. If you fly at a point below that curve, you will be gaining energy, you will either gain speed, or have the ability to climb in the turn.
That’s why, when we compare the EM diagrams for different fighters by overlaying them, the fighter with the higher Ps = 0 curve has a sustained turn rate advantage, and is most likely to win a sustained turning engagement. So, one of the first things to notice when you look at an overlay of this type, is to compare the Ps curves across the envelope, to see where you can gain energy, or lose it less quickly, while out turning your opponent. But that’s if the fight ever gets to a sustained turning engagement! A high sustained turn rate isn’t everything, fast transients are also important. For example, an aircraft with a high pitch rate or high instantaneous turn rate could end the fight early by getting the first shot. That ability is defined by the highest point on the envelope, either the one defined by the 25.2 angle of attack limit, or the one defined by the corner plateau caused by the CAT 1 Limiter. Naturally, the Russian aircraft that have relatively high angle of attack limits have an advantage in that department, and can reach maximum instantaneous turn rate values far in excess of the CAT 1 limited F-16, albeit a brief advantage due to the resulting rapid loss of energy. Now, I know you want to see a concrete example of this, and in a moment we will look at the F-16 v MiG-29 engagement, but firstly let’s compare the diagram above for the current default F-16, with previous versions of the F-16 flight model.

