Results – Synthetic Testing
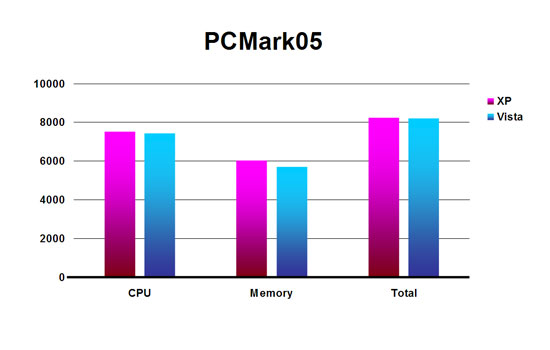
PCMark05, like all of Futuremark’s benchmark suites, is made up of a series of tests designed to stress specific subsystems, such as drive, processor, or memory performance. Since hard drive performance is largely determined by the mechanics of the drive itself, SimHQ decided to use just CPU and memory among the individual test suites and the total system score, or marks.
|
Windows
XP Pro |
Windows Vista Ultimate
|
|
| CPU |
7527
|
7423
|
| Memory |
6022
|
5692
|
| Total |
8231
|
8204
|
The difference among the above scores is statistically irrelevant, though the memory suite showed the largest gap with a roughly 5% dip below the XP result. The total system score for Vista, however, is a mere 27 points lower than XP’s result, a great showing for Microsoft’s new OS.
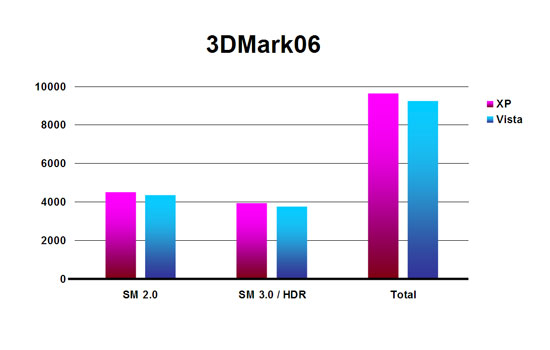
3DMark06’s graphics suites consist of two groups: Shader Model 2.0 tests and Shader Model 3.0/HDR tests. Below we show the individual scores for these two suites and the total score, or marks, which includes the heavily threaded processor tests. All 3DMark tests were run at 1280×1024, with 4x anti-aliasing and anisotropic filtering enabled via the application.
|
Windows
XP Pro |
Windows
Vista Ultimate |
|
| SM 2.0 |
4503
|
4354
|
| SM 3.0/HDR |
3927
|
3776
|
| Total |
9652
|
9252
|
Again, the test results between the two operating systems are basically irrelevant, though Vista does consistently score slightly lower in each category. This could be the result of the new driver model, slightly higher system overhead on the new OS’ part, or, most likely, a small difference in the polish between NVIDIA’s driver sets for the two OSes.
Related Posts:

Related posts:
 Intel’s Core 2™ Extreme QX6700: Quad Core Performance Preview Page 3
 OS Shootout 2007: Windows XP Professional vs. Windows Vista Ultimate
 Page 3
OS Shootout 2007: Windows XP Professional vs. Windows Vista Ultimate Page 4
OS Shootout 2007: Windows XP Professional vs. Windows Vista Ultimate Page 5
OS Shootout 2007: Windows XP Professional vs. Windows Vista Ultimate Page 6
OS Shootout 2007: Windows XP Professional vs. Windows Vista Ultimate Page 7
OS Shootout 2007: Windows XP Professional vs. Windows Vista Ultimate
OS Shootout 2007: Windows XP Professional vs. Windows Vista Ultimate Page 3
OS Shootout 2007: Windows XP Professional vs. Windows Vista Ultimate Page 4
OS Shootout 2007: Windows XP Professional vs. Windows Vista Ultimate Page 5
OS Shootout 2007: Windows XP Professional vs. Windows Vista Ultimate Page 6
OS Shootout 2007: Windows XP Professional vs. Windows Vista Ultimate Page 7
 The New Intel Core™ i7 and Simulations Page 2